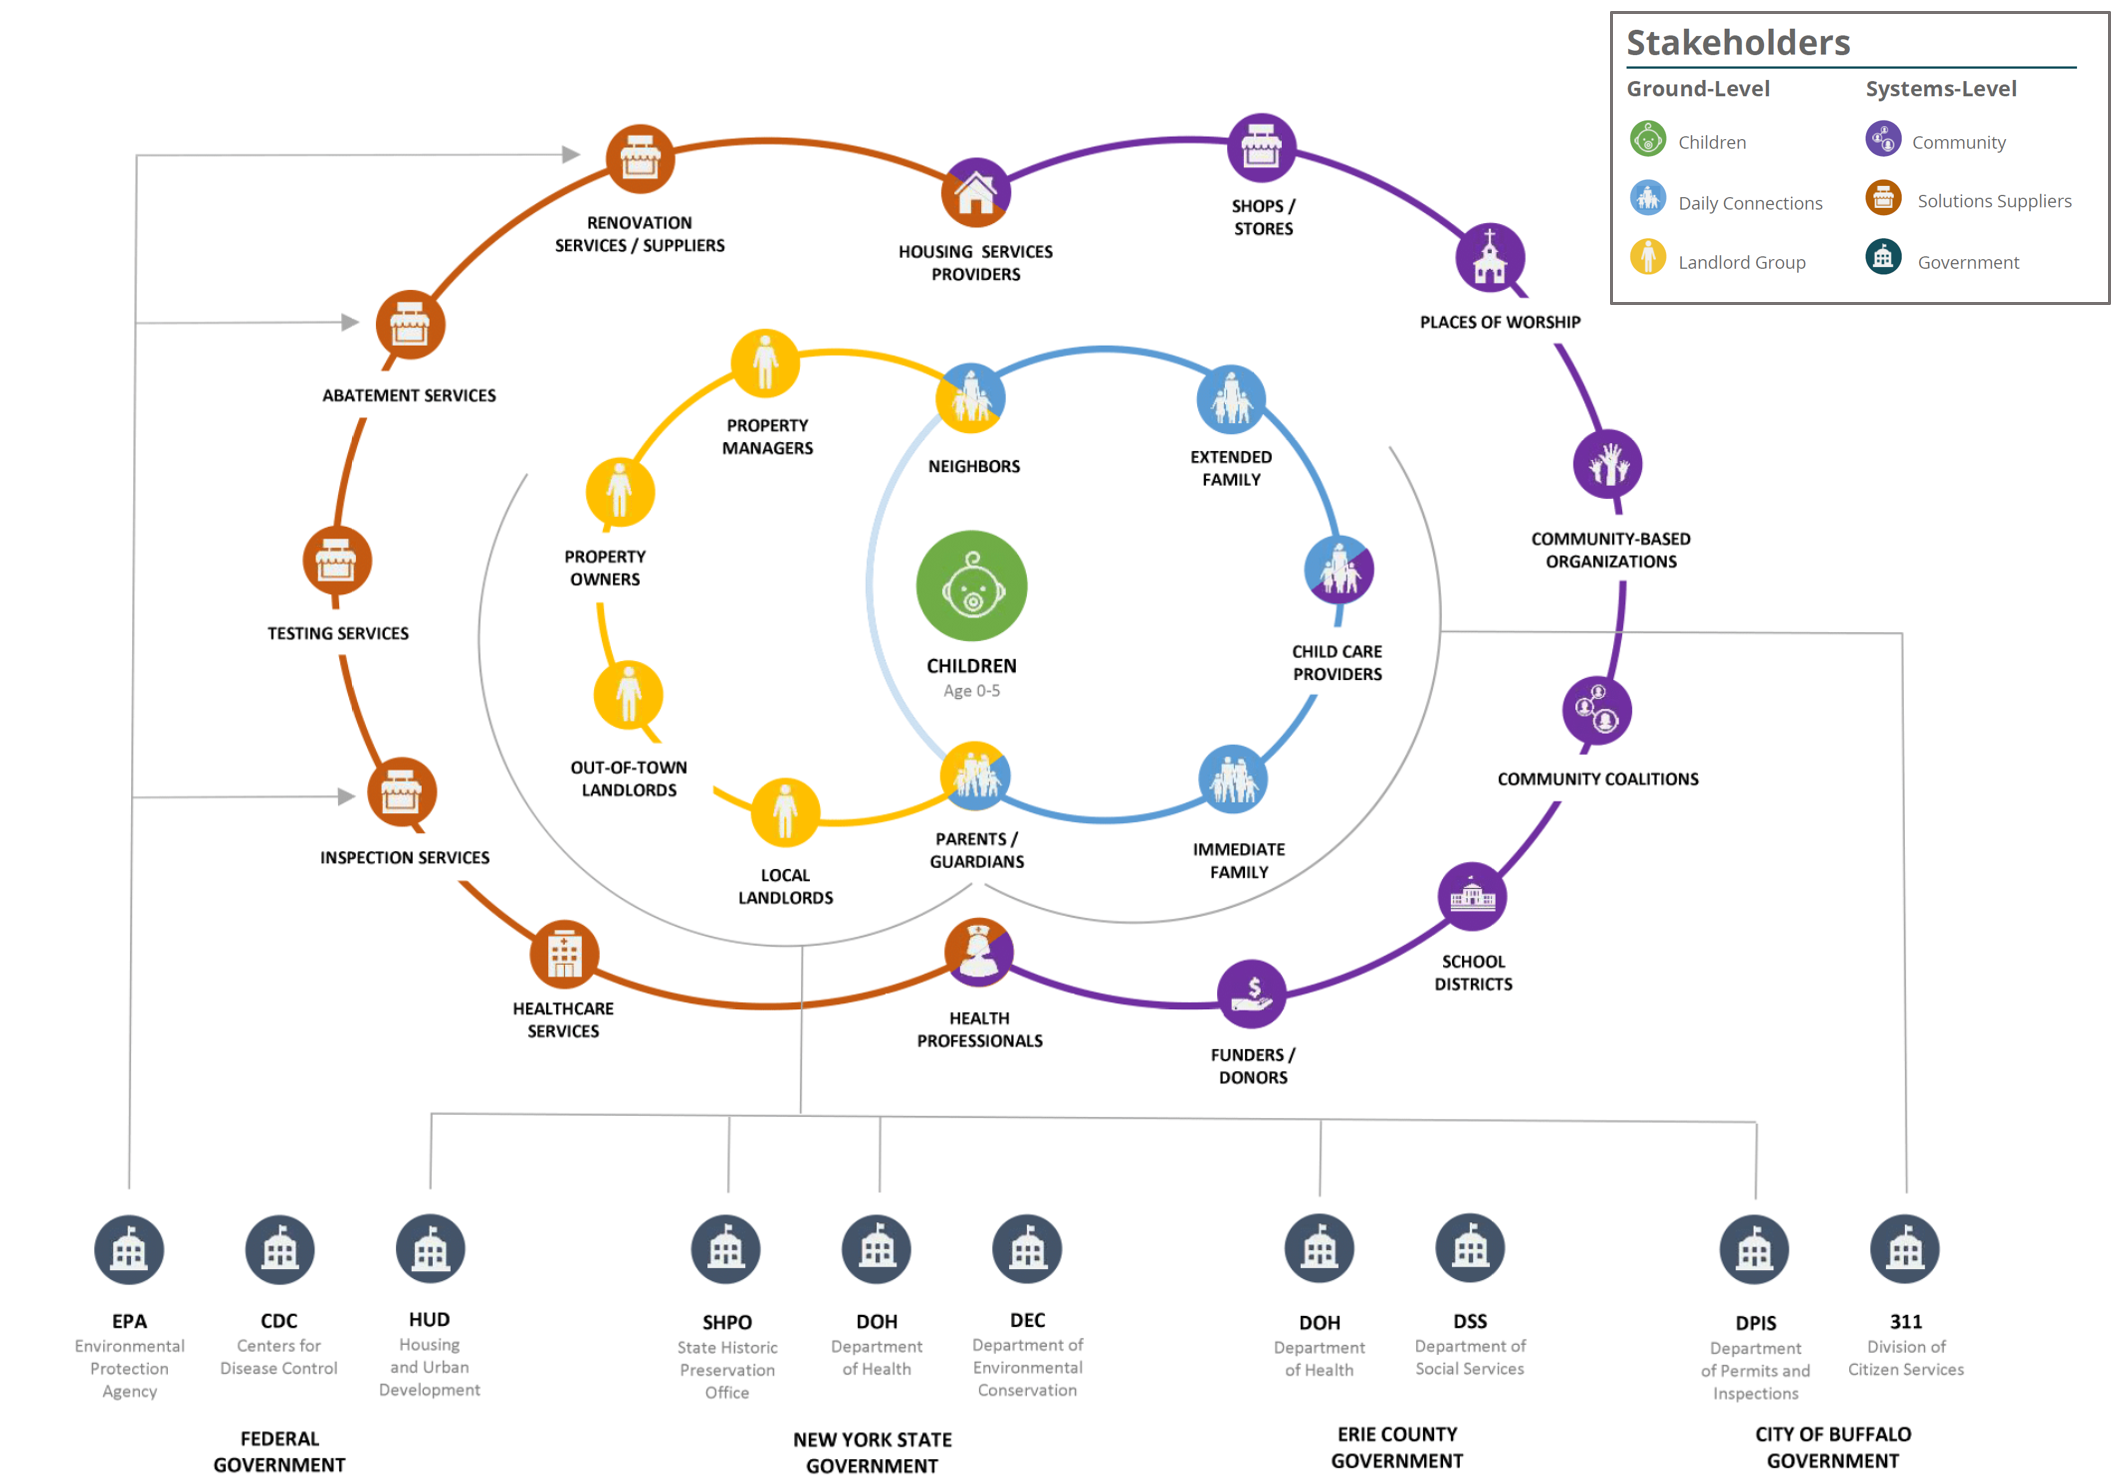
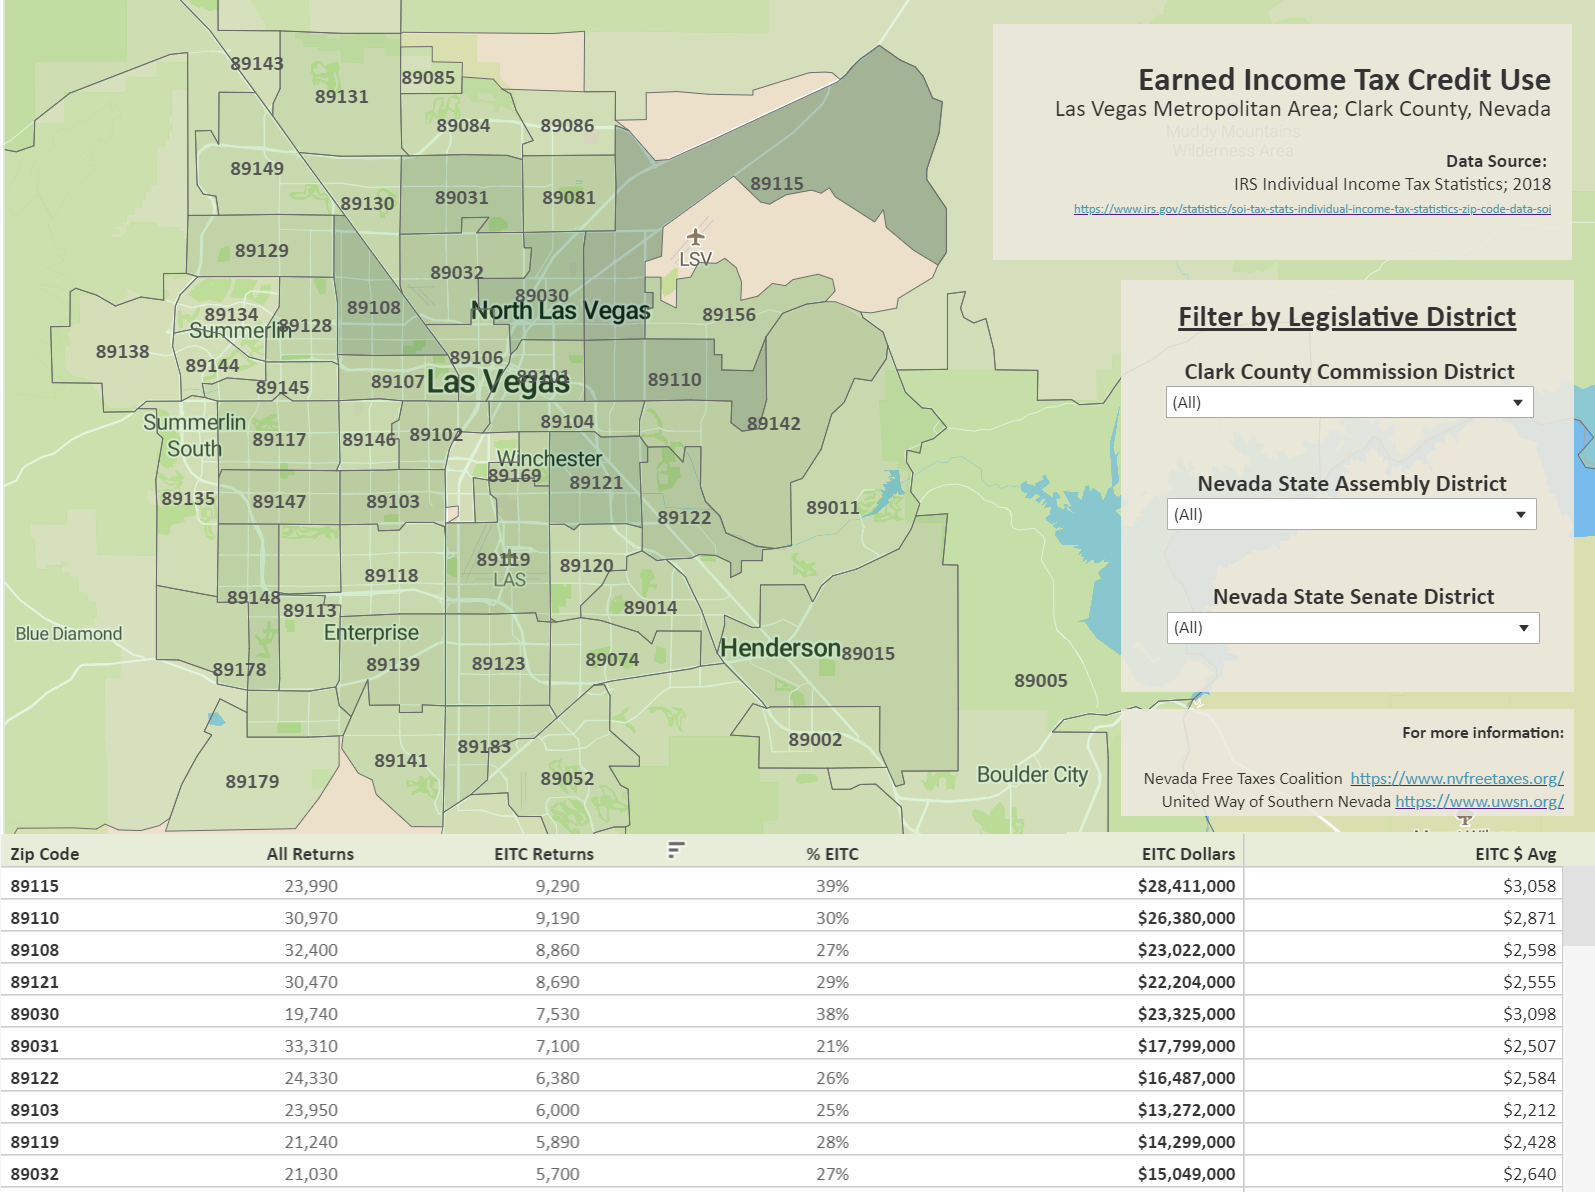
This gallery shares examples of the maps, data visualizations, and infographics created for clients as part of their work in social impact, community development, and environmental sustainability. View my current interactive dashboards at United Way of Southern Nevada’s Tableau Public Profile.
View fullsize
![]()

View fullsize
![]()

View fullsize
![]()

View fullsize
![]()

View fullsize
![]()

View fullsize
![]()

View fullsize
![]()

Like anything you see?


